September 2, 2019.
By NASA;
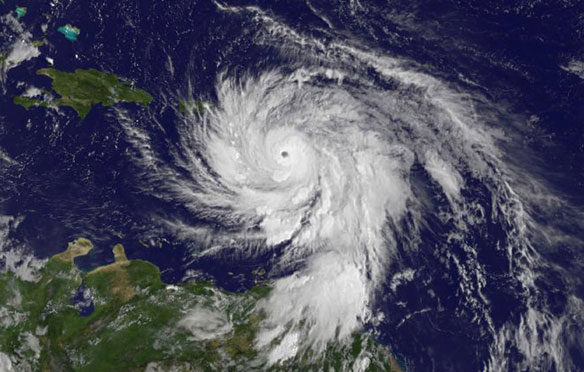
When Dorian developed in the Atlantic Ocean during the last week of August 2019, steering winds pushed the storm forward at a respectable rate—about 10-15 miles (16-24 kilometers) per hour. So when the hurricane passed between Puerto Rico and the U.S. Virgin Islands, damage from the storm surge, rain, and wind was modest, explained NASA atmospheric scientist Marangelly Cordero-Fuentes. But as the intensifying storm approached the Bahamas, its forward motion slowed to an excruciating pace.
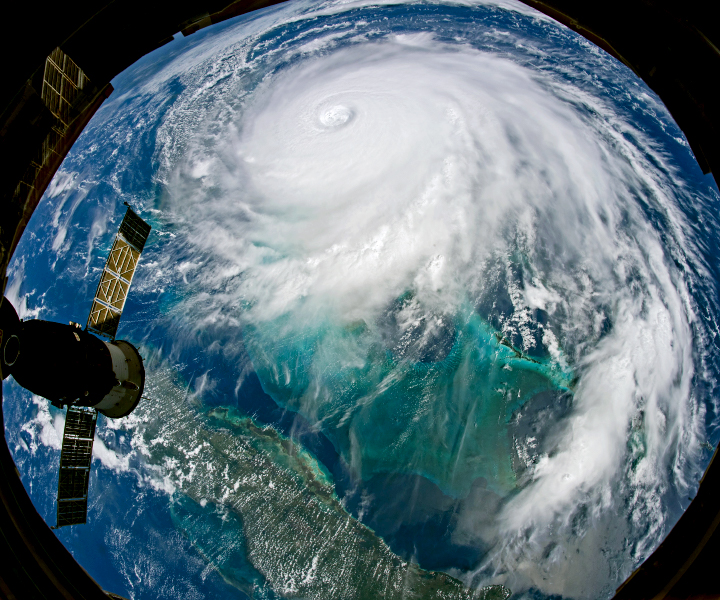
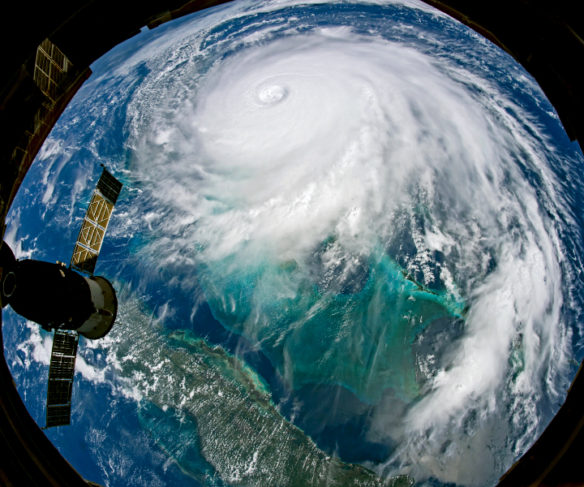
A nightmare scenario unfolded. The second strongest Atlantic hurricane in modern meteorological records stalled over Grand Bahama, the northernmost of the Bahama Islands. Late on September 1 and early on September 2, Dorian was moving at just a few miles per hour and blowing maximum sustained winds as high as 185 miles (295 kilometers) per hour. Dorian was “stationary,” the National Hurricane Center reported. For an extraordinary 40 consecutive hours, the storm hovered over the small island, lashing it with extreme rain, waves, and wind.
When Dorian finally began drifting north, it left a wake of catastrophic damage in the Bahamas. Preliminary assessments indicated that nearly 70 percent of homes were underwater at some point. The Red Cross reported roughly 13,000 homes were destroyed or severely damaged.
“A storm that stalls means more extreme rain, more extreme winds, more extreme damage,” explained Timothy Hall, NASA Goddard Institute of Space Studies scientist. “Stalling over a populated area is the absolute last thing you want to see a hurricane do.”
The visualization above, a combination of rainfall accumulation and wind speed data, highlights Dorian’s remarkable behavior. Notice how rainfall rates rose sharply as the storm slowed down on September 2-3, 2019. By September 4, satellites estimated that an extraordinary 60 inches (150 centimeters) of rain fell over parts of Grand Bahama.
The rainfall data comes from the Integrated Multi-satellite Retrievals for GPM (IMERG); much of it is collected by the Global Precipitation Measurement (GPM) satellite. The wind data come from the Goddard Earth Observing System Model (GEOS), an experimental weather model that scientists at NASA use to analyze global weather phenomena. The GEOS model ingests wind data from more than 30 sources, including ships, buoys, radiosondes, dropsondes, aircraft, and satellites.
The chances that a storm will stall seem to be rising for hurricanes in the North Atlantic. Hall recently published a study with NOAA atmospheric scientist James Kossin reporting that storms have been moving slower and stalling more over the past seven decades. Of the 66 storms that stalled in the North Atlantic basin between 1944 and 2017, nearly two-thirds did so within the past 25 years.
Hall sees climate change as a possible driver of this stalling trend, though he cautions that a connection between climate and stalling is not as definitive as the evidence that climate change is altering storms in other ways. For instance, there is more evidence that climate change is making hurricanes stronger and capable of producing more rain.
“I’m glad that people are talking about stalling as an additional feature in the hazards of tropical cyclones,” Hall told Science News. “Category is important, but it’s not the be-all, end-all of a storm’s hazard. There’s the physical size of the storm, how it moves, the angle at which it impacts the coastline—all of which are going to have an effect on storm surge and flooding.”
After swamping the Bahamas, Dorian has moved north and now appears poised to move along the coasts of Florida, Georgia, South Carolina, North Carolina, and Virginia. While forecasters think the eye of the storm will stay offshore, it will still produce dangerous storm surge, wind, and rainfall in all of these states.

