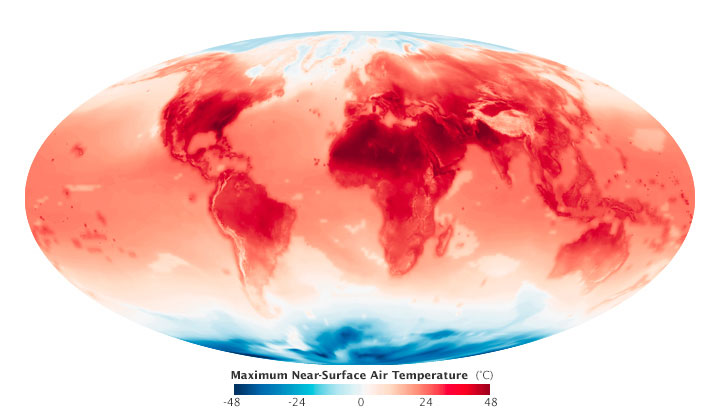
NASA Earth Observatory maps by Joshua Stevens, using Global Daily Downscaled Climate Projections from the NASA Earth Exchange (NEX). 2014

2099 projection.
By Mike Carlowicz, NASA / Earth Observatory;
On June 9, 2015, NASA released data showing how temperature and rainfall patterns worldwide may change through the year 2100 as a result of growing concentrations of greenhouse gases in Earth’s atmosphere.
The 11-terabyte data set is freely available to the public and shows projected changes in response to different scenarios of increasing carbon dioxide. The high-resolution data—which can be viewed at the spatial scale of individual cities and towns, and at time scales down to a single day—will help scientists and civic planners conduct climate risk assessments to better understand the local effects of global change.
“NASA is in the business of taking what we’ve learned about our planet from space and creating new products that help us all safeguard our future,” said Ellen Stofan, NASA chief scientist. “With this new global data set, people around the world have a valuable new tool to use in planning how to cope with a warming planet.”
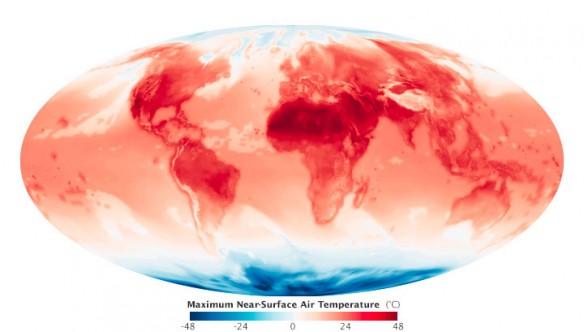
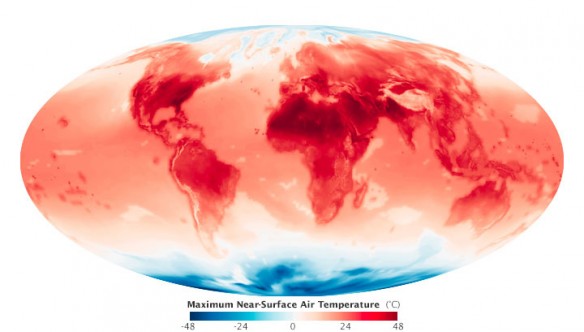
The maps above show model projections of maximum air temperatures near the ocean and land surface on the June solstice in 2014 and 2099. The maps were constructed from the NASA Earth Exchange Global Daily Downscaled Projections (NEX-GDDP) data set, which combines historical measurements with data from 21 general circulation model simulations in the Coupled Model Intercomparison Project Phase 5 (The CMIP5 model runs were developed in support of the Fifth Assessment Report of the Intergovernmental Panel on Climate Change.) Shades of red depict temperatures up to 48 degrees Celsius (118 degrees Fahrenheit) above zero, with blue shades representing temperatures down to 48°C below zero (-54°F). Turn on the image comparison tool and note how some regions are significantly warmer in 2099 than in 2014.
The new NEX-GDDP model projections show how global temperature (above) and precipitation (not shown) might change under different greenhouse gas emissions scenarios, including a “business as usual” scenario based on current trends and an extreme case with a significant increase in emissions. The projections provide a detailed view down to a resolution of 0.25 degrees (25 kilometers or 16 miles) and cover the time period from 1950 to 2100.
The new data set is a product of the NASA Earth Exchange (NEX), a big-data research platform within the NASA Advanced Supercomputing Center at the Ames Research Center. NEX pulls together state-of-the-art supercomputing, Earth system modeling, workflow management, and NASA remote-sensing data. NEX data and analysis tools are available to the public through the OpenNEX project on Amazon Web Services. OpenNEX is a partnership between NASA and Amazon, Inc., to enhance public access to climate data.
“This is a fundamental data set for climate research and assessment with a wide range of applications,” said Ramakrishna Nemani, NEX project scientist. “NASA continues to produce valuable community-based data products on the NEX platform to promote scientific collaboration, knowledge sharing, and research and development.”


