By Nicole L. Russell and Gary B. Griggs, Department of Earth and Planetary Sciences, Institute of Marine Sciences, University of California Santa Cruz, Santa Cruz,
ABSTRACT
In 2010, the California Resources Agency funded a project to develop a guide for assisting local governments in sea-level rise adaptation planning: “Adapting to Sea- Level Rise: A Guide for California’s Coastal Communities” (Russell and Griggs 2012). An assessment of the vulnerability of the city of Santa Barbara to future sea- level rise (by the years 2050 and 2100) and related coastal hazards served as a case study for the development of the adaptation guide.
Historically damaging events, shoreline topography and development, and exposure to sea-level rise and wave attack were evaluated for Santa Barbara, as were the likely impacts of potential future coastal hazards to specific areas of the city, risk levels, the city’s ability to respond, and potential adaptation measures.
The case study finds that the risk of wave damage to shoreline development and infrastructure in Santa Barbara will be high by 2050 and very high by 2100. Choices are limited and adaptive capacity will be moderate, with retreat as the most viable long-term option. By 2050, flooding and inundation of low-lying coastal areas will present a moderate risk to the city, which will have a moderate capacity for adaptation. The risks are expected to be very high and adaptive capacity will be low by 2100.
Cliff erosion has taken place for decades, threatening public and private property in the Mesa area. The risk of increased cliff erosion rates will be moderate by 2050 and very high by 2100. Because armoring is ineffective along the Mesa and retreat would necessitate the relocation of structures, adaptive capacity will be low. Inundation of beaches presents a low threat to the city by 2050 but a high threat by 2100.
The city faces a dilemma: Protect oceanfront development and infrastructure or remove barriers and let beaches migrate inland. By 2100, structures will have to be moved if beaches are to be maintained.
Gobal sea level is rising. As a result, many coastal communities will face tough choices for adapting to the future conditions and/or dealing with the consequences. Although the precise rate of future sea-level rise is impossible to predict because of the uncertainties in the factors that affect future climate and thus sea level, a 2011 survey of California’s coastal professionals suggests that most are well aware that sea level is changing and will continue to change well into the future (Finzi Hart et al. 2012).
Participants in the assessment also indicated that adaptation to sea-level rise is a high priority for coastal communities. Fortunately, the state of California is supporting their cause. The California Coastal Commission recently announced that it will award a total of $1 million in grants in early 2014 to local governments that successfully apply for assistance to update their Local Coastal Programs, with special consideration for updates that address the effects of climate change.
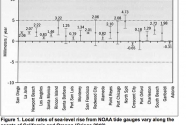
Tide gage records indicate that the average rate of global sea-level rise was 0.8 to 2.2 mm/yr (Figure 1). From Cape Mendocino to the Canadian border, the coastline lies above a subduction zone, where accumulating stress tends to raise the land. While there are some regional tectonic differences along this nearly 1,000-km (600-mi) stretch of coastline, tide gage data show that local rates of sea-level rise are generally lower than the global average and in some cases, local sea level is dropping because the rate of uplift outpaces the rate of sea-level rise. These phenomena suggest that coastal communities must tailor sea-level rise adaptation plans to fit the unique needs of their own localities.
Relative to the year 2000, sea level is projected to rise along the California coast south of Cape Mendocino by 5-30 cm (2-12 in) by the year 2030, 13-61 cm (5-24 in) by 2050, and 43-168 cm (17-66 in) by 2100. From Cape Mendocino to Puget Sound (Washington) in the north, sea level is projected to change by -5 to +23 cm (-2 to +9 in) by 2030, -3 to +48 cm (-1 to +19 in) by 2050, and 10-142 cm (4-56 in) by 2100 (NRC 2012). (These projections have ranges due to the con- sideration of multiple climate models.) However, these figures do not account for the next great Cascadia Subduction Zone earthquake, which would likely cause much of the region north of Cape Mendocino to immediately subside and local sea level to suddenly rise by at least 1 m (3.3 ft) (NRC 2012).
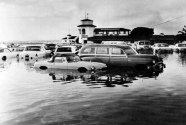
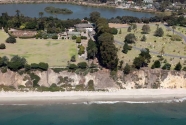
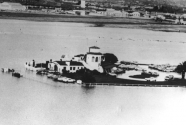
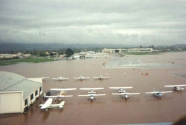
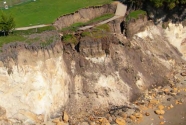
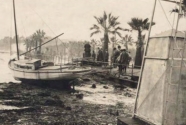
The ocean’s gradual advance upon low-lying shorelines will lead to the eventual permanent inundation or erosion of beaches that are backed by development or barriers, such as seawalls, roads, parking lots, and other structures. While permanent inundation is expected to occur gradually over the long-term, the most significant threats to California’s shoreline over the next few decades will continue to be short-term episodic events, such as storms. Storm waves and associated storm surges that arrive during high tides are especially damaging when sea level is elevated during strong El Niño winters (NRC 2012). However, a rising sea level is expected to increase the frequency and severity of these and other short-term events that coastal communities are used to experiencing, such as occasional storm flooding (Figure 2) and cliff or bluff erosion (Figure 3). Additionally, floodwaters and waves can be expected to reach higher elevations and move further inland than they have in the recent past. This will threaten private homes, businesses, and public property, including critical low-lying infrastructure, such as highways, bridges, power plants, and sewage treatment facilities along the coastline, many of which have already been threatened, damaged, or destroyed by storms in past years.
It is likely that sea-level rise will have a significant impact on California’s economy. A 2011 state-commissioned study (King et al.) uses sea-level rise projections to estimate the potential economic losses due to flooding and beach erosion or five California beach communities. A 1.4-m (55-in) rise in sea level by the year 2100 could lead to a total loss (i.e. total accumulated loss between now and the year 2100) of at least $440 million in tourism spending and tax revenue at Venice Beach alone (King et al. 2011). This estimate is likely conservative because it assumes that population and income will not grow after the year 2010.
Adaptation planning is still in its early stages and there is a need for technical assistance and the ongoing translation of scientific information into forms that are readily understood by coastal planners and managers (Finzi Hart et al. 2012). Given this insight and the fact that each community is unique in terms of land motion (and thus rate of local sea-level change), topography, demographics, poli- tics, etc., California’s Resources Agency funded an effort to develop a guide for assisting local governments in their preparations for future sea-level rise.
While there are many existing documents about climate change vulnerability and adaptation, it appears that none of them are focused specifically on local sea-level rise. “Adapting to Sea-Level Rise: A Guide for California’s Coastal Communities” provides scientific background information about sea-level rise and walks users through the processes of performing local sea-level rise vulnerability assessments, risk analyses, and formulating and implementing sea-level rise adaptation plans (Russell and Griggs 2012). This guide is now available online, courtesy of the California Ocean Science Trust.
The methods presented in this guide were developed in part through our assessment of the vulnerability of the city of Santa Barbara, California to sea-level rise and related coastal hazards, which can serve as an example for other coastal communities (Griggs and Russell 2012). See: “City of Santa Barbara Sea-Level Rise Vulnerability Study.”
SEA-LEVEL RISE AND THE CITY OF SANTA BARBARA
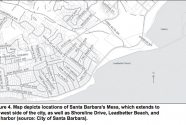
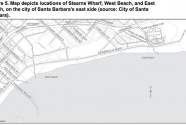
The city of Santa Barbara is located along the central California coast, about 145 km (90 mi) northwest of Los An- geles. Its approximately 8-km (5-mi) east-west trending coastline faces south and includes cliffs, bluffs, and beaches (Figures 4 and 5). The low-lying Santa Barbara Airport is also part of the city, although it is located about 5 km (3 mi) west of the city proper. The “City of Santa Barbara Sea-Level Rise Vulner- ability Study” (Griggs and Russell 2012) evaluates the vulnerability and adaptive capacity of the city of Santa Barbara to sea-level rise by the years 2050 and 2100. Sea-level rise is expected to increase the magnitude of coastal hazards and loss of resources from storm damage, flooding, sea cliff and bluff erosion, and shoreline erosion. A variety of physical, ecological,economic, and social consequences can be expected to result from these changes. The vulnerability study qualitatively assesses risks to the city, emphasizing the potential consequences for public property and infrastructure, as well as private property and development along the coastline.
Materials and methods
This project was initiated while the city of Santa Barbara was completing a general plan revision and an environmental impact report (EIR) that included a climate change component. At the beginning, we met with relevant city departments to explain the project’s objectives, ask for information and suggestions, and find out what kinds of information were desirable to city staff. Follow-ups provid- ed useful information and photographs of historical coastal storm damage, flooding, and cliff erosion.
Historical aerial photographs from the California Coastal Records Project proved to be very useful for evaluating conditions and development along the city’s coastline. In addition, the city’s revised general plan and EIR highlighted areas that were historically and/or are currently vulnerable to coastal storms, flooding, and erosion, as well as the areas that will likely be vulnerable to coastal impacts associated with future sea-level rise. We used the state of California’s sea-level rise projections to assess haz- ards: 25-43 cm (10-17 in) by 2050 and 1-1.4 m (3.3-4.6 ft) by 2100 (projections relative to the year 2000). (These values were recommended in 2010, prior to the release of the 2012 NRC report.) City department staff reviewed draft versions of the vulnerability assessment and adaptation recommendations.
For adaptation to future changes, a coastal community must have an understanding of both its vulnerability to the expected changes and its risk, as adaptation to sea-level rise is a risk management strategy for an uncertain future. For the purposes of this study, vulnerability is defined as the degree of exposure to a relatively high sea level or to the com- bined effects of an elevated sea level plus a major coastal storm and/or high tide. On the other hand, risk includes both the probability that a future event (i.e. coastal flooding, inundation, or increased cliff erosion) is likely to occur, as well as the magnitude (or level of severity) of the event. Thus, a vulnerability assessment should include an evaluation of the level of a community’s exposure to coastal hazards, as well as the potential magnitudes of the damages or losses from events that are known to elevate sea level significantly, such as large El Niño storms or storm surges.
Finally, adaptive capacity must be evaluated. Adaptation is defined as the adjustment of natural or human systems in response to actual or expected events and their effects, such that losses are minimized. Thus, a coastal community’s adaptive capacity is defined by its ability to respond to sea-level rise and its associated impacts, including the avoidance, reduction, or moderation of potential damages, as well as its ability to cope with the expected or predicted consequences of such impacts.
Conducting the assessment
Several types of coastal processes have the potential to affect communities like Santa Barbara. Each of the following needs to be evaluated and considered in planning efforts:
- Sea-level rise
- Coastal storm damage
- Runoff and flooding
- Cliff or bluff retreat
- Shoreline or beach retreat
It is also important to understand that the effects of these individual processes can be cumulative and any combination can be more severe or damaging than a single event. The city of Santa Barbara has been damaged during such events in the past and will experience them again in the future, most likely with an increased frequency under rising sea levels. The impacts of those events are also expected to increase in magnitude as a result of sea-level rise.
“ The city faces a dilemma: Protect oceanfront development and infrastructure or remove barriers and let beaches migrate inland. By 2100, structures will have to be moved if beaches are to be maintained.”
— Nicole L. Russell & Gary B. Griggs
The first step in conducting a sea-level rise and coastal hazards vulnerability assessment is to collect information about a community’s historical vulnerability to coastal hazards using reports, maps, surveys, photographs, newspaper archives, interviews, etc. that detail past damages. This will help to delineate historically eroded, flooded, or damaged areas and, therefore, the areas that are most likely to be affected again in the future. Because future rates of erosion are expected to be at least as high as historic rates, a community will need to obtain data for historic cliff, bluff, dune, and beach erosion rates. It is also important to look for informa- tion about previous short-term increases in sea level and exposure to El Niño events. Potential adaptation responses can then be recommended for reducing exposure to future hazards. In this study, specific areas of the city of Santa Barbara were analyzed in order to determine the likely impacts of sea-level rise, the risks that are posed by these hazards, and the city’s ability to respond to them.
The second step is to obtain historic sea-level rise rates using the nearest tide gage or gages, as these can serve as a community’s baseline data. The National Oceanographic and Atmospheric Ad- ministration (NOAA) is a good resource for this information. This step is necessary because rates of sea-level rise vary by tectonic setting along the 1,770-km (1,100-mi) length of California’s coastline.
The third step is to obtain the most recent sea-level rise projections for different future dates (e.g. 2050 and 2100). The estimates provided in the latest NRC report are the standards that were recently adopted by the California state agencies that must consider sea-level rise adaptation measures. It makes sense for local communities to use the same values, although adaptation plans should be adjusted as new sea-level rise projec- tions become available. As previously stated, the Santa Barbara study uses the state of California’s 2010 sea-level rise projections of 25-43 cm (10-17 in) by the year 2050 and 1-1.4 m (40-55 in) by 2100 (relative to sea level of the year 2000), as the NRC’s 2012 values (13-61 cm or 5-24 inches by 2050 and 43-168 cm or 17-66 inches by 2100), were not yet available prior to this study’s completion.
The final step in assessing vulnerability is to identify and map the areas that are likely to undergo flooding in the future, given the most recent sea-level rise projections (for 2050 and 2100). It is best to use the latest high-resolution land surface elevation data, such as Li- DAR data, which can be obtained from NOAA’s Digital Coast website, although utilization of this data requires experience in GIS.
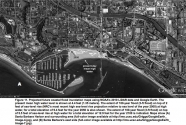
For the latest analysis of Santa Barbara’s potential future flood elevations, 2010 LiDAR data were obtained as digi- tal elevation models from NOAA’s 2009- 2011 CA Coastal Conservancy Coastal LiDAR Project (2011). The horizontal positional accuracy of these data is 51 cm (20 in) or better and the vertical accuracy is 18 cm (7 in) or better (NOAA 2011). Contour lines representing (a) the 1.35 m (4.43 ft) mean high water level (from Hapke et al. 2006), (b) the 100-year flood (0.9 m or 3 ft flood) level on top of mean high water plus 60 cm (2 ft) of sea-level rise (the highest projected sea-level rise by 2050, from NRC 2012), and (c) the 100-year flood level (0.9 m flood) on top of mean high water plus 1.7 m (5.5 ft) of sea-level rise (the highest projected sea- level rise by 2100, from NRC 2012) were added using ArcGIS software. Contour layers were exported as shapefiles and then converted to KML format for use in Google Earth.
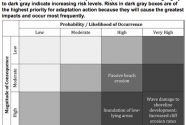
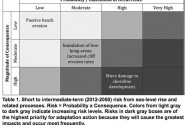
The next course of action is to complete a risk assessment for different endpoints in time (e.g. 2050 and 2100) by evaluating the likelihood that impacts from each sea-level rise-related hazard or process from the vulnerability assess- ment will occur in the future, as well as the magnitudes of the consequences of those events. An assessment of risk also includes an evaluation of adaptive capacity, or the ability of a community to respond to, adapt to, or recover from the changes associated with sea-level rise at different future time periods (NOAA 2010). For this study, we considered the future threats of concern along the city’s coastline (e.g. flooding, cliff and bluff erosion, inundation, and beach loss), the economic importance and value of public facilities and infrastructure, and the value and importance of residential development. Additionally, we assessed the magnitudes of the impacts of future hazardous events, the timing and frequency of such events, and the certainty of occurrences to the degrees that they can be projected (e.g. given that sea level reaches a particular elevation, certain structures will be flooded during storms of a given magnitude). The future risks from hazards that are associated with sea-level rise were evaluated for both a short to intermediate timeframe (2012- 2050) and an intermediate to long-term timeframe (2050-2100). We used three different levels for the magnitude of impact: low, moderate, and high; and four different levels for the probability or likelihood of occurrence: low, moderate, high, and very high. Although the terms “low, moderate, high, and very high” are based upon the sea-level rise scenarios that were originally suggested for use by California’s state agencies, they are used qualitatively in the Santa Barbara report.
Finally, we used the vulnerability and risk assessments to identify adaptation options for each projected hazard. Communities should consider overall effectiveness, general cost-effectiveness, and ease of design and implementation of various strategies. Adaptation to sea- level rise is a relatively new concept and most coastal communities have limited resources for dealing with the consequences of climate change. Ideally, a city or county would determine the economic/historic/cultural, etc. values of all of its coastal infrastructure, development, recreational areas, etc., for the purpose of ranking their relative levels of vulnerability and importance to the com- munity. Planning staff could then focus upon the critical areas, such as facilities and development that are sited at the lowest elevations, infrastructure that is critical for meeting the needs of the community (e.g. sewage transmission lines, pumping stations, or treatment plants), and structures or infrastructure that are closest to the edges of eroding cliffs or bluffs. In this way, a community could stagger its adaptive efforts in phases, rather than attempting to tackle all areas simultaneously.
We utilized a ranking system for various risks to the city of Santa Barbara’s coastline by 2050 and 2100 using California’s 2010 projections for sea-level rise and emphasized the effects of anticipated future sea-level rise on public property and infrastructure, as well as private property (Tables 1 and 2). Suggested adaptation measures include a broad range of approaches: future planning for hazard avoidance, engineering (including retrofitting, rebuilding, construction, and protection), and retreat or relocation.
RESULTS AND DISCUSSION
Flooding
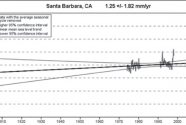
Santa Barbara has a NOAA tide gauge (established in 1973) but, due to displacement during various construction projects, the record is discontinuous and of limited value (Figure 6). However, if the tide gage remains stationary in the future, the record should become reliable and over time it will provide a long-term indication of local sea-level rise rate. The study recommends that all precautions be taken in order to protect the existing NOAA tide gauge at the breakwater from future construction or disturbance, such that a long-term record of local sea level change can be established.
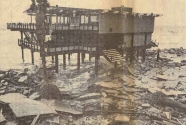
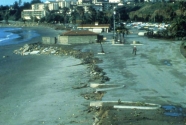
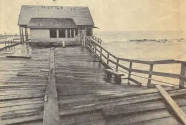
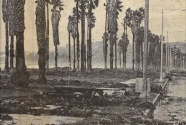
As sea level rises, there will be an increased number of extreme high water events, which tend to occur when high tides coincide with winter storms and their associated high winds, storm surges, and wave run-up. Santa Barbara has suffered the effects of such events in the past. While sea level is temporarily elevated for several months during El Niño years, a particularly devastating storm during the 1983 El Niño was also accompanied by high tides, large waves, and storm surge, which eroded portions of the beachfront park facilities, damaged the yacht club and harbormaster’s office, and reached almost to Shoreline Drive (Figures 7-9; Figure 4 shows location of Shoreline Drive). Waves also carried debris onto Cabrillo Boulevard at Palm Park along East Beach (Figure 10; Figure 5 shows location of Cabrillo Boulevard).
Where streams meet the coast, back- water conditions can occur as elevated sea levels (from high tides, storm surges, or, over the long-term, from rising sea levels) prevent floodwaters from draining rapidly, causing streams to back up or slow down, which can lead to upstream flooding. Currently, flooding occurs dur- ing high tides and major storm events but these problems will be exacerbated in the future with increasing sea levels.
“ Retreat, or gradual relocation of the cliff-top homes or infrastructure, is the most effective long-term approach.”
— Nicole L. Russell & Gary B. Griggs
The city’s 2009 coastal flood hazard map was updated using NOAA’s (2011) LiDAR data, which has improved surface elevations. The new images show contour lines for the present mean high water level and for the potential future extent of 100- year flooding, based on the NRC’s 2012 sea-level rise projections for 2050 and 2100. The images were created using ArcGIS and Google Earth in order to produce maps with easily identifiable geographic features (Figures 11A-B). Both the 2009 city map and the new maps are limited in that the areas highlighted as being subject to flooding include all areas that are lower than the critical elevations, even though some of those areas are inland and not directly connected to the shoreline.
An increase in the number of extreme high water events will likely accelerate rates of cliff retreat and increase damage to public and private oceanfront properties and development, including city infrastructure. These types of events pose the greatest threats to the Santa Barbara coastline for the near-term future (until about 2050). Historically, damage to shoreline structures and infrastructure has been moderate but this is expected to increase to high in the near-term (by 2050) with 36 cm (14 in) of sea-level rise (pre-NRC 2012 value) because damage is already happening at present-day sea level (Table 1). The magnitude of damage will increase to very high by the year 2100 if sea level rises by 1.2 or more meters (at least 3.9 ft; pre-NRC 2012 value) above the year 2000 sea level (Table 2). Park facilities, parking lots, development at the harbor, the municipal wharf, Shoreline Drive, Cabrillo Boulevard, and associated infrastructure and development that serve visitors along Cabrillo Boulevard will all eventually be at risk from wave attack.
There are limited adaptive measures for the city’s low-lying shoreline areas: beach sand nourishment, armor to pro- tect in place, or relocation of facilities (retreat). Although Leadbetter Beach (Figure 4) was widened by hundreds of feet following breakwater construction in the late 1920s, significant damage still occurred landward of the beach during the 1983 El Niño winter. West and East Beaches (Figure 5) are now nourished by the discharge of sand dredged from the harbor entrance. Without increasing the height and length of the breakwa- ter, additional sand will probably not solve the challenges that are posed by a significant increase in sea level by 2050.
Furthermore, it is unclear whether there is a source of sand that would be large enough for such a project. While a seawall can help to buffer or protect oceanfront development from wave attack over the short to intermediate-term (until 2050), this may require significant investment in the Leadbetter, harbor, West, and East Beach areas. Over the long-term (from 2050-2100), if 0.9-1.2 m (3-4 ft) of sea-level rise were to occur and the city beaches were greatly reduced in width or eliminated as buffers for the winter months, a seawall would need to be of substantial height. The lifetime of the structure, the protection that would be offered by it, and its potential costs and benefits would need to be carefully weighed against a gradual retreat, which might be the only long-term option as sea level continues to rise.
In addition, rising sea levels and a high water table could begin to interfere with wastewater discharge and/or potentially increase flood hazards at treatment plants in low-lying areas (CCC 2009). The city’s El Estero Wastewater Treatment Plant is located within 400 m (0.25 mi) of the shoreline, at a ground elevation of about 3.6-4.2 m (12-14 ft) above historic mean sea level. While it does not appear likely that the plant could be subject to flooding with a modest increase in sea level, projections show that the facility would be increasingly vulnerable over time to a 100-year flood event with 1.4 m (4.6 ft) of sea-level rise. Thus, sea-level rise may necessitate the modification of plant facilities or operations in the com- ing decades.
Airport flooding and inundation
The Santa Barbara Municipal Airport, located about 13 km (8 mi) west of down- town Santa Barbara, is the largest com- mercial service airport on the California coast between San Jose and Los Angeles, providing a major economic benefit to the South Coast. The airport was originally built on artificial fill within and upon the margins of the Goleta Slough. As such, it is located only a few feet above sea level, much like the San Francisco and Oakland International Airports, as well as many other airports in coastal cities around the world. Because it lies in an area where five streams converge, the airport has historically been subject to flooding. In 1969, water completely surrounded the main terminal (Figures 2 and 12). In 1995 and 1998, all three runways were flooded, closing the airport for several days (Figure 13). Public buildings and structures are threatened by inundation during heavy rains and runway flooding poses a safety hazard, preventing planes from taking off and landing.
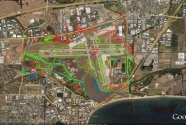
Even without sea-level rise, flooding will occur during intense and prolonged rainfall, which will increase runoff from the streams that drain into the Goleta Slough and combine with high tides. With a rising sea level, the frequency and magnitude of flooding in the area can be expected to increase. NOAA (2011) LiDAR data were used to update the city’s 2009 flood map for the airport area. With 61 cm (24 in) of sea-level rise by 2050, a 100-year flood could reach the runways and get close to the terminals (Figure 14). By 2100, 1.7 m (5.6 ft) of sea-level rise would allow 100-year floodwaters to extend across the entire airport (Figure 14).
Thus, the probability of airport flood- ing is high in the short to intermediate- term (to 2050). If sea-level rise ap- proaches or exceeds 1.2 m (3.9 ft) by 2100, the probability of flooding, with some permanent inundation of the site, will be very high. There are two areas of concern regarding short-term flooding and permanent inundation: 1) the airport terminal and parking areas, and 2) the runways and associated areas for air- planes. While temporary flooding of the runways and airport parking areas will be short-term inconveniences, as they have been in the past, permanent inundation presents an unacceptable risk. The adaptive capacity of the Santa Barbara Airport to future flooding and inundation in the short to intermediate-term is believed to be moderate. It seems possible, although very expensive, to raise the runways in order to accommodate the 100-year flood conditions for the projected high sea level of 2050. However, it appears that neither the terminal nor the runways can easily be adapted to the 100-year flood conditions of 2100 with high projected sea-level rise.
Cliff and bluff retreat
There are 6.4 km (4 mi) of coastal cliffs within Santa Barbara’s city limits. Monterey Shale, capped by unconsoli- dated marine terrace deposits, comprises the majority of these cliffs, which are 15- 30 m (49-98 ft) high. They are susceptible to erosion from both wave attack and terrestrial runoff and they are also prone to landslides and slumps. The bedrock has been deformed and tilted throughout this area and in some places, bedding dips (tilts) towards the beach. This is highly conducive to bluff failure, in which slid- ing occurs along exposed bedding planes. The cliffs at both ends of the city are experiencing active erosion and retreat. Historic aerial photographs were used to determine average long-term erosion rates, which range from about 15 to 30 cm/yr (6 to 12 in/yr) (Griggs et al. 2005). Hapke and Reid (2007) completed a statewide assessment that compares cliff edge position on aerial photographs from the 1930s with LiDAR data from 1998 (approximately a 70-year period) and obtained similar values: an average of 10-46 cm/yr (4-18 in/yr) for the Mesa area in the west (Figure 4) and about 15 cm/yr (6 in/ yr) for the Clarke Estate/Cemetery cliffs in the east. The range in erosion rates is a product of local variations in bedrock strength, bedding plane orientation, and the effects of development and human interference, including the placement of protective riprap on the fronting beaches. However, the overall linear trend of the bluff edge along the Mesa indicates that long-term rates of cliff retreat are fairly uniform alongshore.
Cliffs may appear to go unchanged for years until the right combination of groundwater saturation, tidal height, wave attack, and/or seismic shaking, causes episodic failure. The loss of two homes on the Mesa in 1978 illustrates how landsliding along the bluff edge can result in the nearly instantaneous loss of oceanfront property and structures. The winter of 1978 saw the first large El Niño event in years, and rainfall was heavy in Santa Barbara for several weeks prior to the slide. The Mesa failure was a typical rotational slump on a curved failure (rupture) surface, with a nearly vertical head scarp.
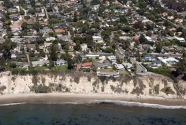
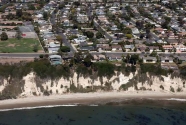
Google Earth was used to measure distances from the cliff edge to homes along the Mesa. There are about 98 cliff-front dwellings along the Mesa and nearly half of these are within 30 m (98 ft) of the cliff edge, while eight of them are within 15 m (49 ft). These homes were constructed at different times and setback distances from the cliff edges vary. Some homes or their additions (such as decks, patios, and other accessory structures) are located immediately adjacent to or within 5-10 m (16-33 ft) of the cliff edge (Figures 15 and 16). The proximity of a large number of homes and their additions to the cliff edge, combined with the cliff’s general instability and long-term retreat rates, results in a moderately high vulnerability to future cliff retreat and accelerated ero- sion due to a rising sea level.
On 25 January 2008, Shoreline Park (on the Mesa) suffered a landslide that extended 20 m along the cliff and moved the cliff edge inland by as much as 12 m (39 ft) (Figure 17). Since the park’s construction in the late 1960s, different sections of the cliff at the park have retreated intermittently. As erosion has occurred, walkways, picnic tables, and fencing have been relocated inland. Progressive retreat of the cliff fronting Shoreline Park is expected to continue, possibly by an increased rate, in the future.
The cliffs that front the Clarke Estate and the adjacent cemetery on the city’s east side are also subject to landsliding (Figure 3). Riprap was placed at the base of the bluff below the estate in the 1980s. This has reduced wave impact but it has not halted the failure of overlying materials, which appears to proceed primarily due to terrestrial processes. Below the cemetery, on the east end of the bluffs, an old con- crete seawall gradually deteriorated, so riprap and some cliff-top retaining walls were constructed in its place in an attempt to slow erosion. Many years ago, several groins were built in this area in order to trap littoral drift and widen the beach but these have also deteriorated over time and are no longer effective. Some of the gravesites that were once closest to the cliff edge have been moved back over time.
A continued rise in sea level will allow waves to attack the bases of cliffs and bluffs with an increased frequency, which will increase erosion. With average his- toric retreat rates between 15-30 cm/yr (6 to 12 in/yr), a loss of at least 3-6 m (10-20 ft) can be expected over the 20-year lifes- pan (by 2030) of Plan Santa Barbara. Total retreat could be higher than that in places where uncontrolled drainage, historic landslides, or adverse bedding planes exist (AMEC 2010). Over the short to intermediate-term (2012-2050), the probability of significantly increased cliff erosion rates is considered to be moderate (Table 1). However, the prob- ability is likely to increase substantially to high or very high over the intermediate to long-term (2050-2100; Table 2). If cliff erosion rates on the Mesa remain close to their historical values or double (to 30-60 cm/yr or 12-24 in/yr), the cliff edge could retreat by 12-24 m (39-79 ft) by 2050. Such retreat would directly threaten 30 or more homes, as well as a number of secondary structures. With increased ero- sion rates, Santa Barbara can expect to see 24-50 m (79-164 ft) of erosion from the present cliff edge by 2100. This will affect oceanfront walkways, trails, a play- ground, picnic areas, and two restrooms at Shoreline Park that are located within 15 m (49 ft) of the present cliff edge.
This magnitude of retreat would threaten or necessitate the relocation or removal of about 67 cliff-top homes on the city’s west side. If erosion rates increase in the future, the number of affected homes will also increase. With nearly all of the oceanfront Mesa-area homes likely to be affected by 2100, this is deemed to have a high impact over the intermediate to long-term timeframe (Table 2). A conservative prediction here and in other similar areas is that the rate of cliff erosion will increase in the future and the rate of increase will be related to the extent of sea-level rise, as well as any changes in wave climate. The study recommends the establishment of a cliff edge monitoring program with a set of surveyed transects that can be regularly re-measured in order to document and track rates of retreat along all sea cliffs within city limits.
There are two basic approaches for adapting to cliff or bluff erosion within the city of Santa Barbara or elsewhere: armor or retreat.
Because of the height of the cliffs and the typical failure mechanisms (large slumps or landslides), armoring is not likely to be an effective long-term solution. The situation along the cliffs below the Clarke Estate and the cemetery is similar to that of the Mesa. Although scattered riprap has been placed there over the years, it has been ineffective in halting cliff erosion because failure is occurring high on the cliff, as a result of terrestrial processes. While beach-level armoring is unlikely to be an effective mechanism for halting cliff erosion in this location, the land at the Clarke Estate and the cemetery is not highly developed, so retreat is a relatively easy option.
Retreat, or gradual relocation of the cliff-top homes or infrastructure, is the most effective long-term approach. The overall capacity of the city to adapt to the hazards of increased cliff retreat is low because there is no buffer zone or physical space to allow for retreat without relocation of structures.
Inundation of beaches
The likelihood of the inundation of city beaches (i.e. passive erosion or permanent coverage by seawater) will de- pend upon beach widths and elevations, as well as the future rate(s) of sea-level rise. Inundation, as opposed to short-term flooding, is defined as an essentially permanent condition. Leadbetter (Figure 4), West, and East beaches (Figure 5) have all eroded or flooded temporarily in the past, with waves reaching Cabrillo Boulevard under severe storm conditions (Figures 9 and 18). Over short to interme- diate timeframes (i.e. 2012 to 2050), there is a low probability of the permanent loss of city beaches under the 36-cm (14-in) sea-level rise scenario (Table 1). There may be some beach narrowing by 2050 but this is not likely to be very noticeable. An El Niño event will likely cause more beach flooding than will gradual sea- level rise, but the former is a short-term phenomenon lasting only a few days or weeks. Over the long-term (2050-2100), sea-level rise will gradually begin to cover low-lying areas that are fixed by back-beach barriers (such as seawalls, parking lots, buildings, etc.), which will eventually include all of the shoreline and beach areas closest to sea level. Seawater will reach further inland as sea-level rise continues, permanently covering previously dry land. For instance, areas that would have formerly only been tempo- rarily flooded or submerged during very high tides or El Niño conditions, such as freeway underpasses, will gradually begin to be submerged permanently.
“ All city beaches could potentially narrow and gradually disappear, and be replaced by shallow water or wet sand at low tide by 2100.”
— Nicole L. Russell & Gary B. Griggs
All city beaches could potentially narrow and gradually disappear, and be replaced by shallow water or wet sand at low tide by 2100. This would negatively affect tourism, beach use, and recreation. Any narrowing or loss of beaches would pro- gressively expose public facilities, such as the coastal bike trail, public parking lots, restrooms, and development at the Santa Barbara Harbor, Stearns Wharf, and along shoreline streets, to periodic flooding and/or increased damage from wave action. The study recommends the establishment of a set of beach profiles along the city shoreline and a set of winter and summer profiles from Cabrillo Boulevard to the shoreline to be surveyed annually, with profile spacing of about 500 ft (150 m). This would track both seasonal and long-term changes.
The ability to adapt to the potential inundation or loss of Santa Barbara’s beaches is low to moderate, depending on the particular beach in question. Allowing beaches to migrate inland and the shoreline to retreat as sea level gradually rises presents challenges for the city be- cause there is valuable development and infrastructure along the entire back edge of the beaches, from Leadbetter to East Beach.
Ultimately, park facilities and parking lots could be abandoned and the structures could be removed in order to allow the beach to migrate inland across the former shoreline. By the time that the ocean reaches Shoreline Drive, a major thoroughfare, projections for sea-level rise in the decades between 2050 and 2100 will likely have improved, such that the risks and options for adaptation can be assessed more accurately than they can be today. If Santa Barbara’s beaches are to be maintained, adaptation may ultimately require removal or relocation of the facilities between the shoreline and Cabrillo Boulevard. Adaptive capacity is deemed moderate because most of these facilities are potentially movable.
CONCLUSIONS
Sea-level rise is becoming an increasingly significant concern to many U.S. coastal communities and state and federal agencies, especially in light of the recent devastation caused by Hurricane Sandy. A rising sea level is expected to exacerbate the effects of all coastal storms, increasing the frequency and magnitude of coastal flooding, as well as the extent and rate of cliff, bluff, and beach erosion, with associated damage to shoreline infrastructure and development. Adaptation to sea-level rise is one important local approach to minimizing future risks and damages to coastal communities.
Sea-level rise adaptation is still an emergent concept, so there are few case studies and scarce information for city planners and coastal managers who want to begin the processes of assessing local vulnerability, performing risk analyses, and formulating and implementing their own adaptation plans.
Adapting to Sea- Level Rise: A Guide for California’s Coastal Communities (Russell and Griggs 2012) is a resource that should aid coastal communities both in and outside of California during the organization and management stages of their efforts to plan for sea-level rise.
The city of Santa Barbara has taken a critical first step towards sea-level rise adaptation by addressing these issues in its 2011 General Plan update and Environmental Impact Report, as well as in its 2012 Climate Action Plan, which incorporates data collection and adaptation planning recommendations from the City of Santa Barbara Sea-Level Rise Vulnerability Study. Furthermore, the city has applied for the California Coastal Commission’s Local Coastal Program Assistance Grant Program to update its Local Coastal Program to reflect the expected impacts of climate change, including sea-level rise.
It will be very useful for Santa Bar- bara and other coastal communities to publicize the results of their adaptation planning and to share them not only with local government staff, elected officials, and the public but also with other coastal communities, which face common issues related to sea-level rise and could benefit from the experience and insight.
REFERENCES:
- AMEC Earth and Environmental Inc. 2010. “Pro- posed Final Program Environmental Impact Report for the Plan Santa Barbara General Plan Update.”
- California Climate Change Center (CCC) 2009. “The impacts of sea level rise on the Califor- nia coast.” 99 p. www.pacinst.org/reports/ sea_level?rise/report.pdf.
- Committee on Sea Level Rise in California, Oregon, and Washington, Board on Earth Sciences and Resources, Ocean Studies Board, Division on Earth and Life Studies, National Research Council (NRC) 2012. Sea-Level Rise for the Coasts of California, Oregon, and Washing- ton: Past, Present, and Future. The National Academies Press, 275 p. http://www.nap.edu/ catalog.php?record_id=13389.
- Department of Commerce, National Oceanic and Atmospheric Administration, National Ocean Service, Coastal Services Center (CSC) 2011. “2009-2011 CA Coastal Conservancy Coastal Lidar Project.” NOAA’s Ocean Service, Coastal Services Center.
- Finzi Hart, J.A., P.M. Grifman, S.C. Moser, A. Abeles, M.R. Myers, S.C. Schlosser, and J.A. Ekstrom 2012. Rising to the Challenge: Re- sults of the 2011 Coastal California Adapta- tion Needs Assessment. USCSG-TR-01-2012.
- Griggs, G.B., 2010. Introduction to California’s Coast and Beaches. University of California Press, 311 p.
- Griggs, G.B., K. B. Patsch, and L.E. Savoy 2005.
Living with the Changing California Coast.
University of California Press, Berkeley, CA, 540 p. - Griggs, G.B., and N.L. Russell, 2012. City of Santa Barbara Sea-Level Rise Vulnerability Study. California Energy Commission Public Interest Energy Research Program, 87 p.
- Hapke, C.J., D. Reid, B.M. Richmond, P. Ruggiero, and J. List 2006. National assessment of shoreline change: Part 3: Historical shoreline changes and associated coastal land loss along the sandy shorelines of the California coast. U.S. Geological Survey Open-file Re- port 2006-1219: 79 p. http://pubs.usgs.gov/ of/2006/1219/of2006-1219.pdf.
- Hapke, C.J., and D. Reid 2007. National Assess- ment of Shoreline Change, Part 4: Historical Coastal Cliff Retreat along the California Coast. U.S. Geological Survey Open File Report 2007-1133: 51 p. http://pubs.usgs.gov/ of/2007/1133/of2007-1133.pdf.
- King, P.G., A.R. McGregor, and J.D. Whittet 2011. The economic costs of sea-level rise to California beach communities. California Department of Boating and Waterways and San Francisco State University, 97 p, http:// www.dbw.ca.gov/PDF/Reports/CalifSea- LevelRise.pdf.
- National Oceanic and Atmospheric Administra- tion 2010. Adapting to Climate Change: A Planning Guide for State Coastal Managers. 138 p. http://coastalmanagement.noaa.gov/ climate/docs/adaptationguide.pdf.
- Russell, N.L. and G.B. Griggs 2012. Adapting to Sea Level Rise: A Guide for California’s Coastal Communities. California Energy Commission Public Interest Energy Research Program, 52 p.


